一文带你使用Apache IoTDB系统监控模块
一文带你使用Apache IoTDB系统监控模块
在Apache IoTDB 0.13.0版本开始,我们引入了系统监控模块,本文主要介绍了如何在单机版开启系统监控模块,并且使用Prometheus + Grafana完成系统监控的可视化。
相关配置信息
- Apache IoTDB:0.13.0,可以前往官网下载:https://iotdb.apache.org/Download/
- Prometheus:2.30.3,可以前往官网下载:https://prometheus.io/download/
- Grafana:8.4.2,可以前往官网下载:https://grafana.com/grafana/download
修改配置文件,启动IoTDB
- 首先,进入到
apache-iotdb-0.13.0-all-bin - 找到监控相关配置文件
conf/iotdb-metric.yml,修改如下配置,其他配置保持不变:
1 | |
- 运行脚本启动IoTDB:
./sbin/start-server.sh,出现如下提示则为启动成功

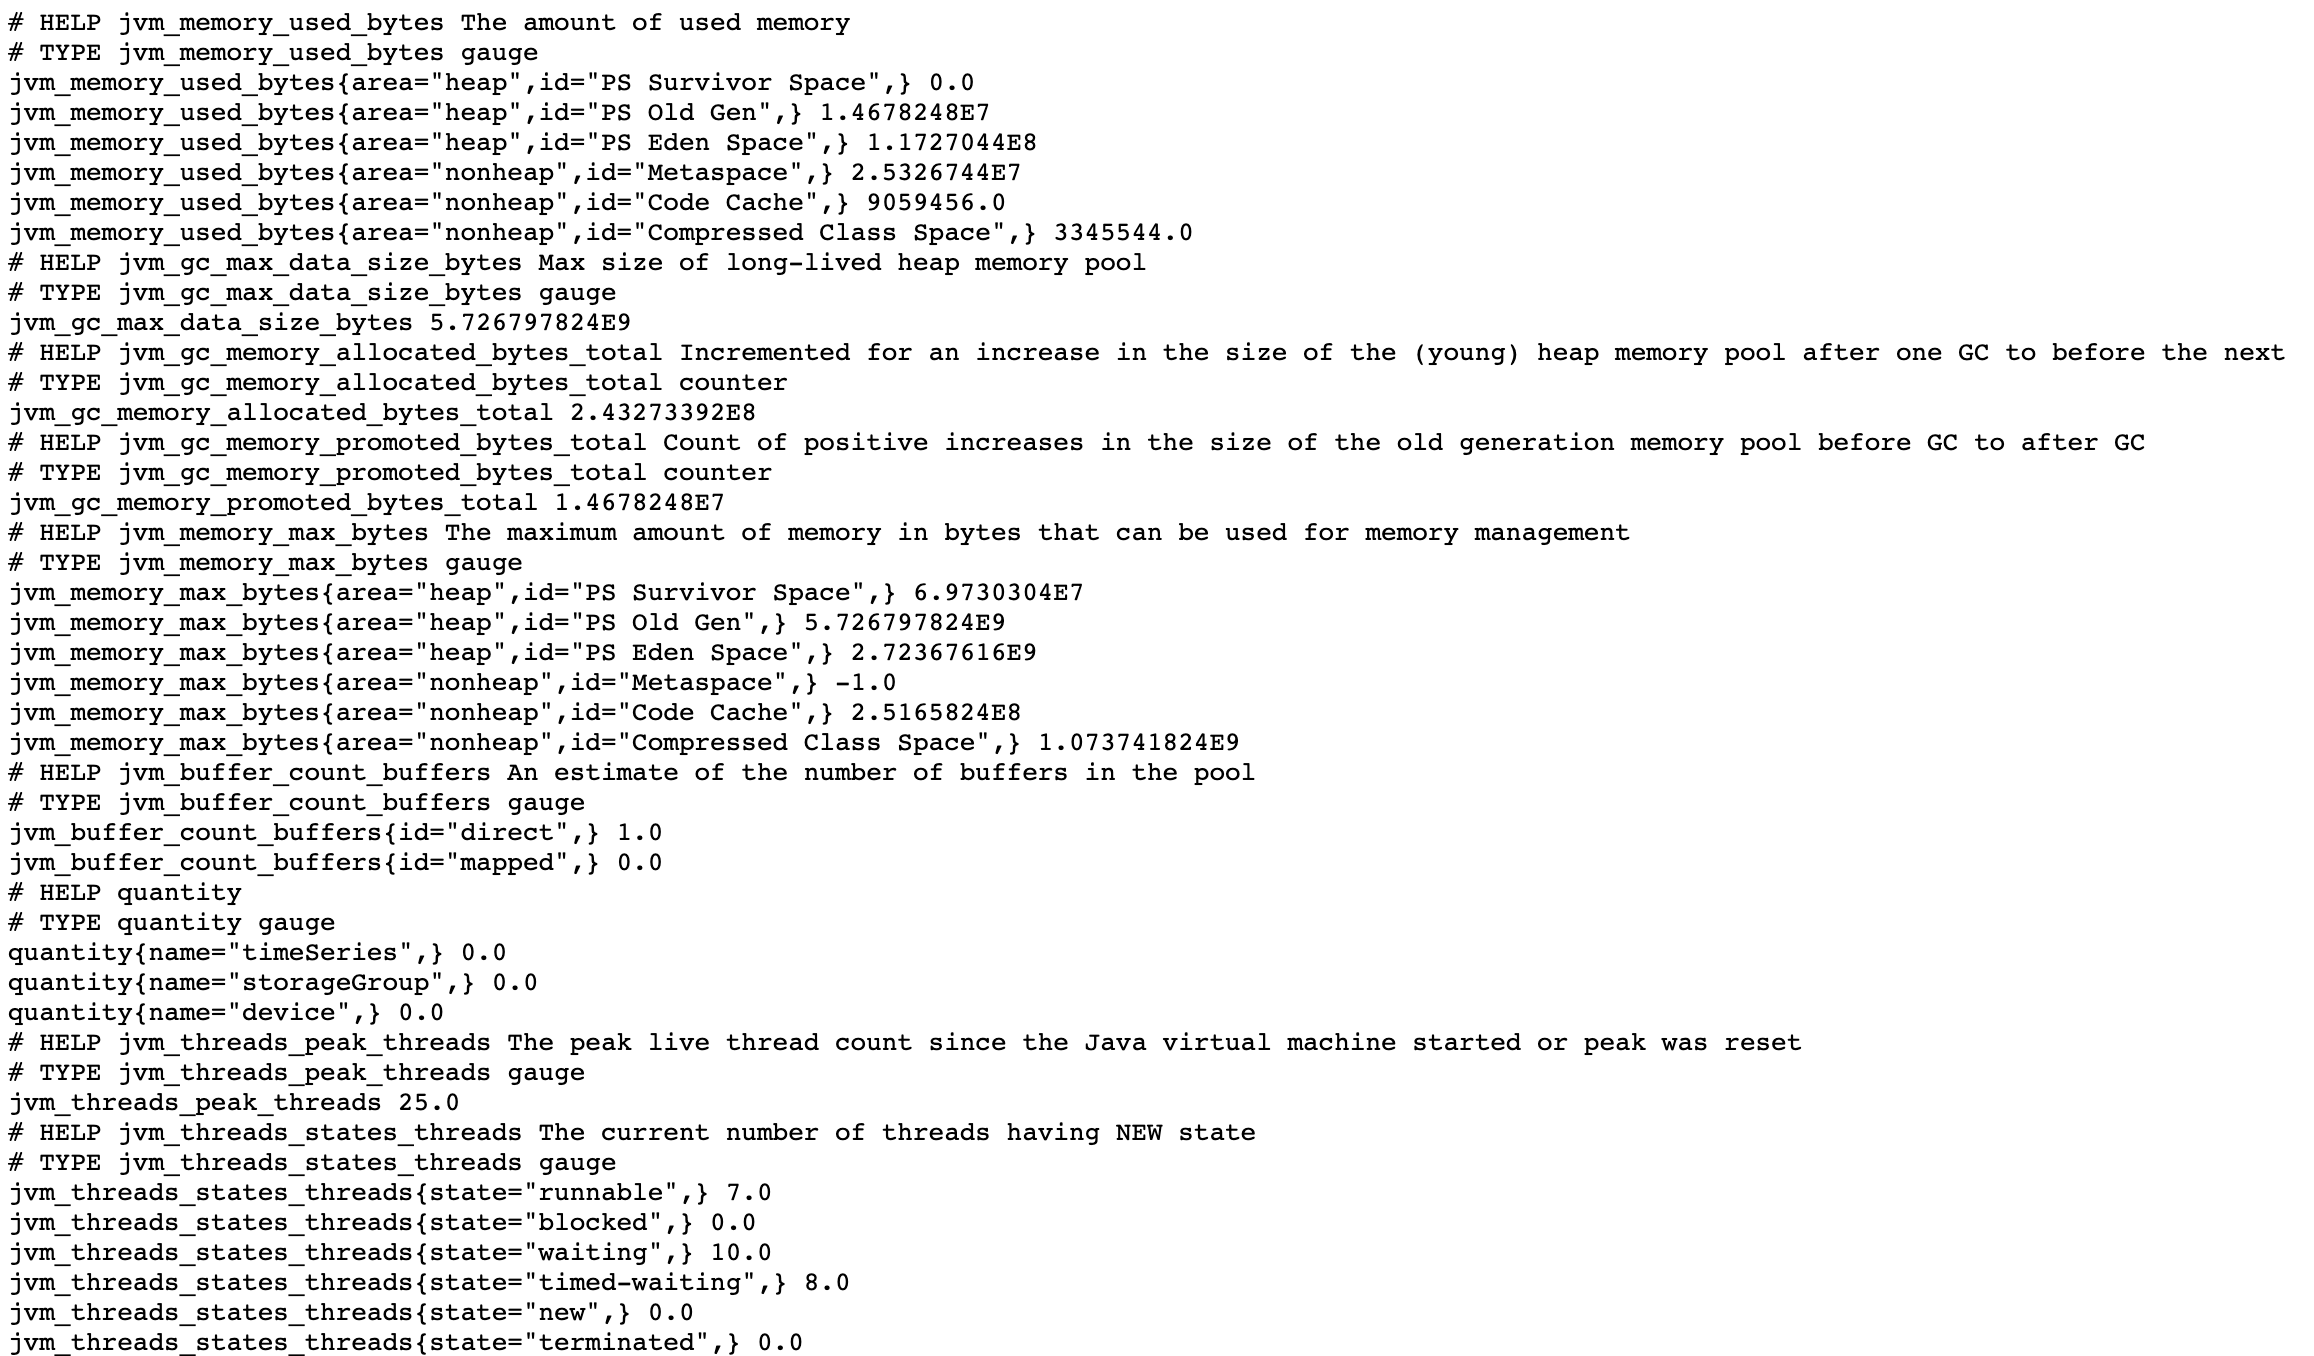
- 在浏览器进入
http://localhost:9091/metrics网址,可以查看到如下的监控项信息:
配置Prometheus进行数据采集
- 下载Prometheus的二进制包到本地,解压后进入对应文件夹:
1 | |
- 首先,我们修改Prometheus的配置文件
prometheus.yml如下:新增iotdb任务收集IoTDB的监控数据
1 | |
- 启动Promethues:
1 | |
- 在浏览器中输入 http://localhost:9090,进入Prometheus
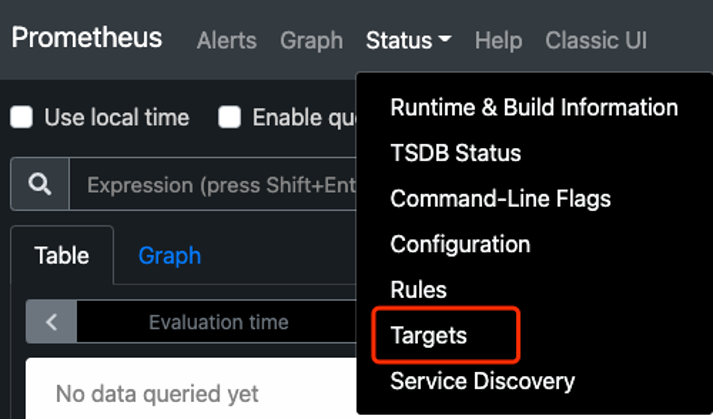
- 查看配置是否成功:我们点击进入Status下的Target界面
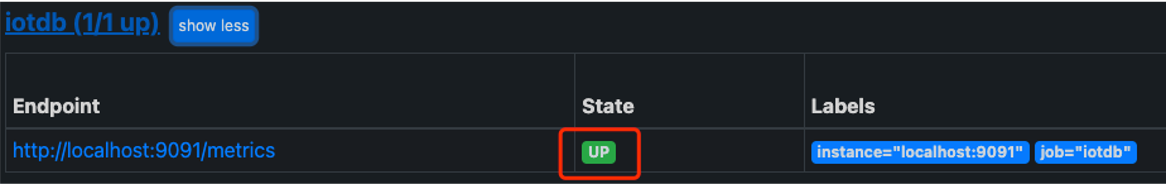
- 当我们看到如下图State为Up时表示配置成功并已经联通
使用Grafana进行数据可视化
Grafana启动与配置
- 下载Grafana的二进制包到本地,解压后进入对应文件夹:
1 | |
- 启动Grafana:
1 | |
- 在浏览器中输入 http://localhost:3000,进入Prometheus
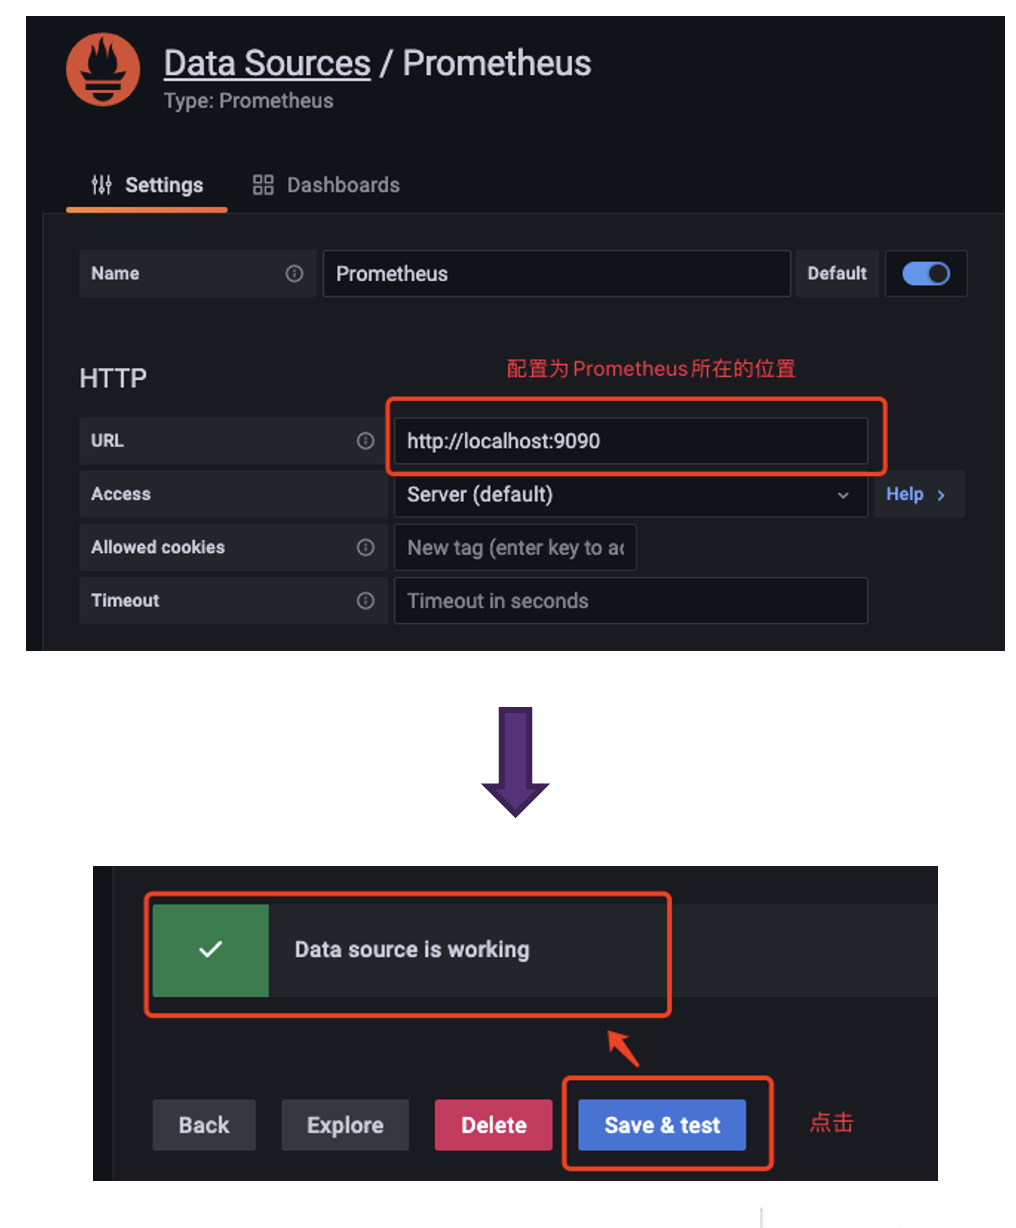
- 首先我们在Configuration中配置Data Source为Prometheus
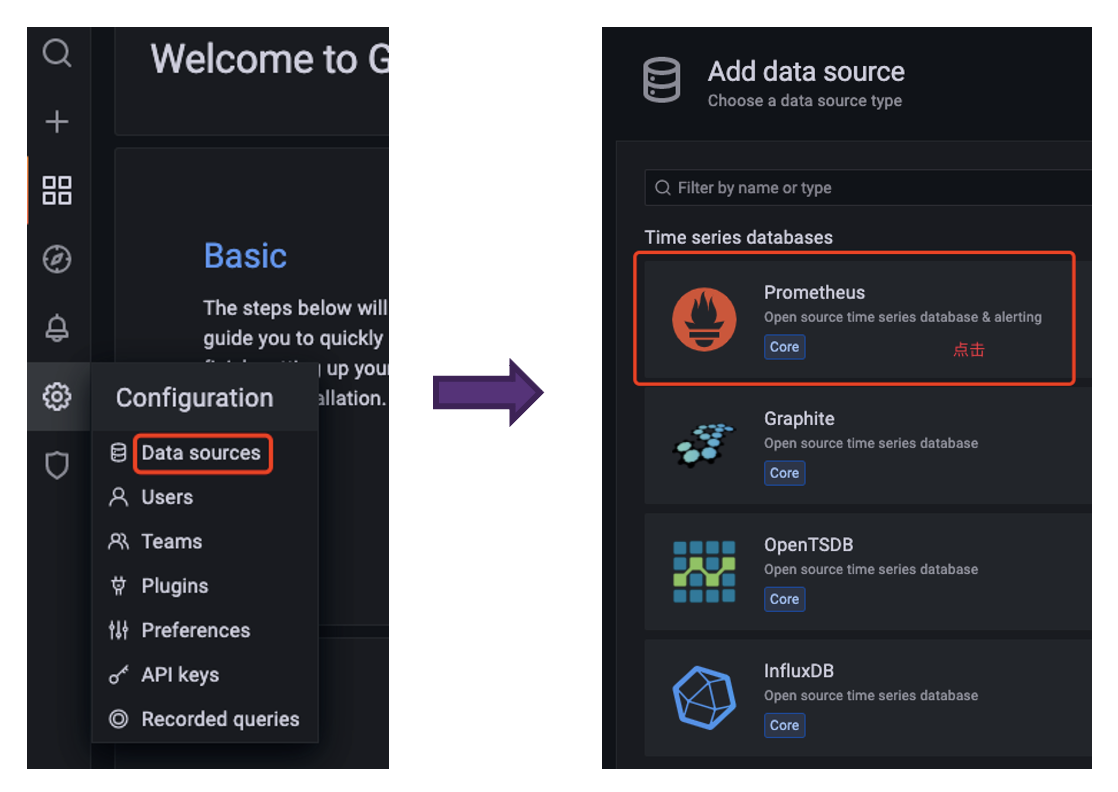
- 在配置Data Source时注意Prometheus所在的URL,配置好后点击Save & Test 出现Data source is working提示则为配置成功
在Grafana中创建Dashboard进行数据可视化
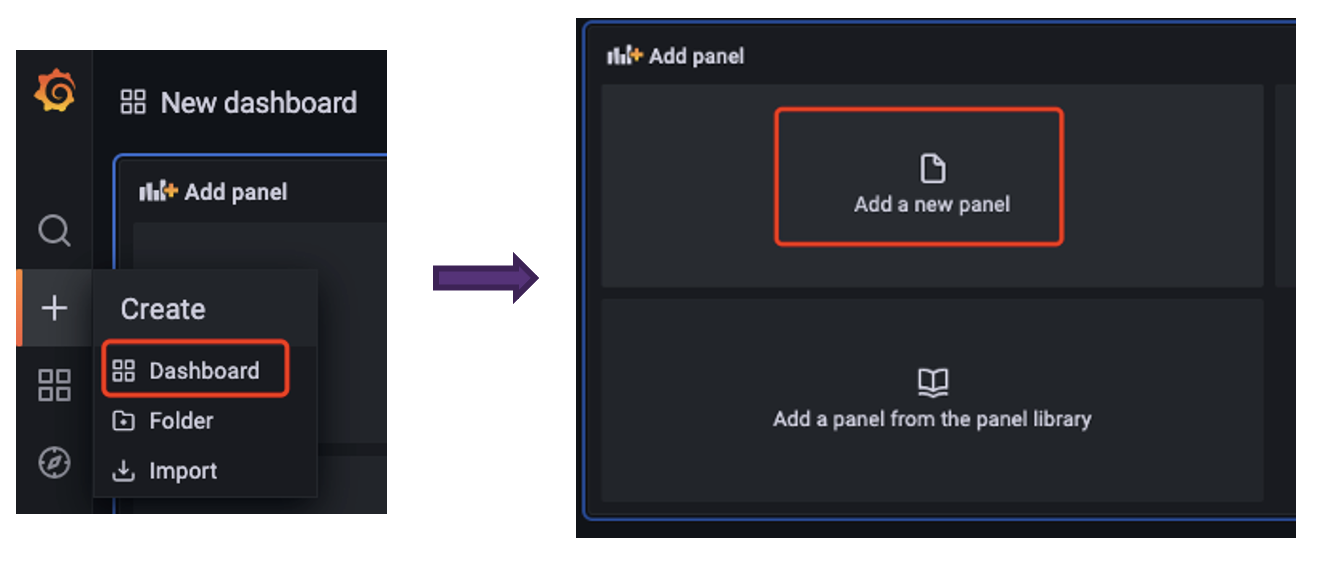
- 首先创建Dashboard,然后创建Panel
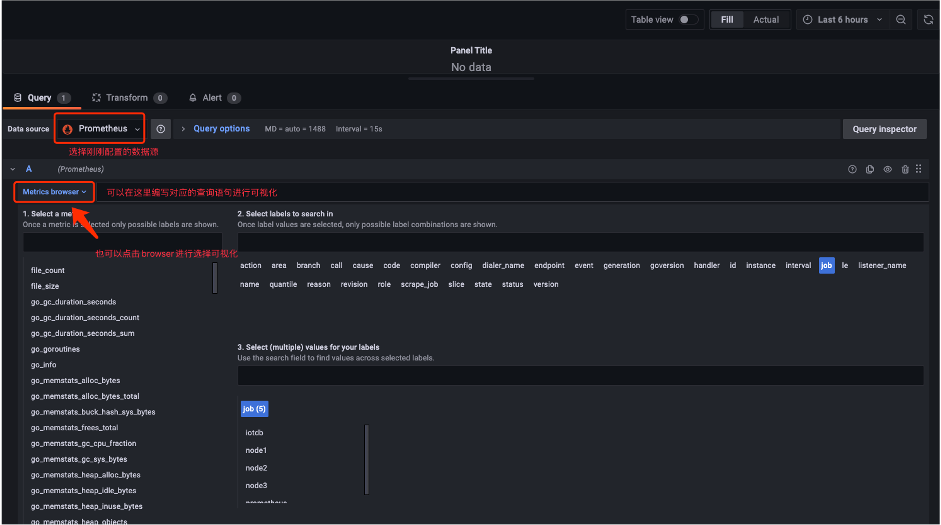
- 之后就可以在面板根据自己的需求对监控相关的数据进行可视化(所有相关的监控指标可以先在job中选择iotdb筛选)
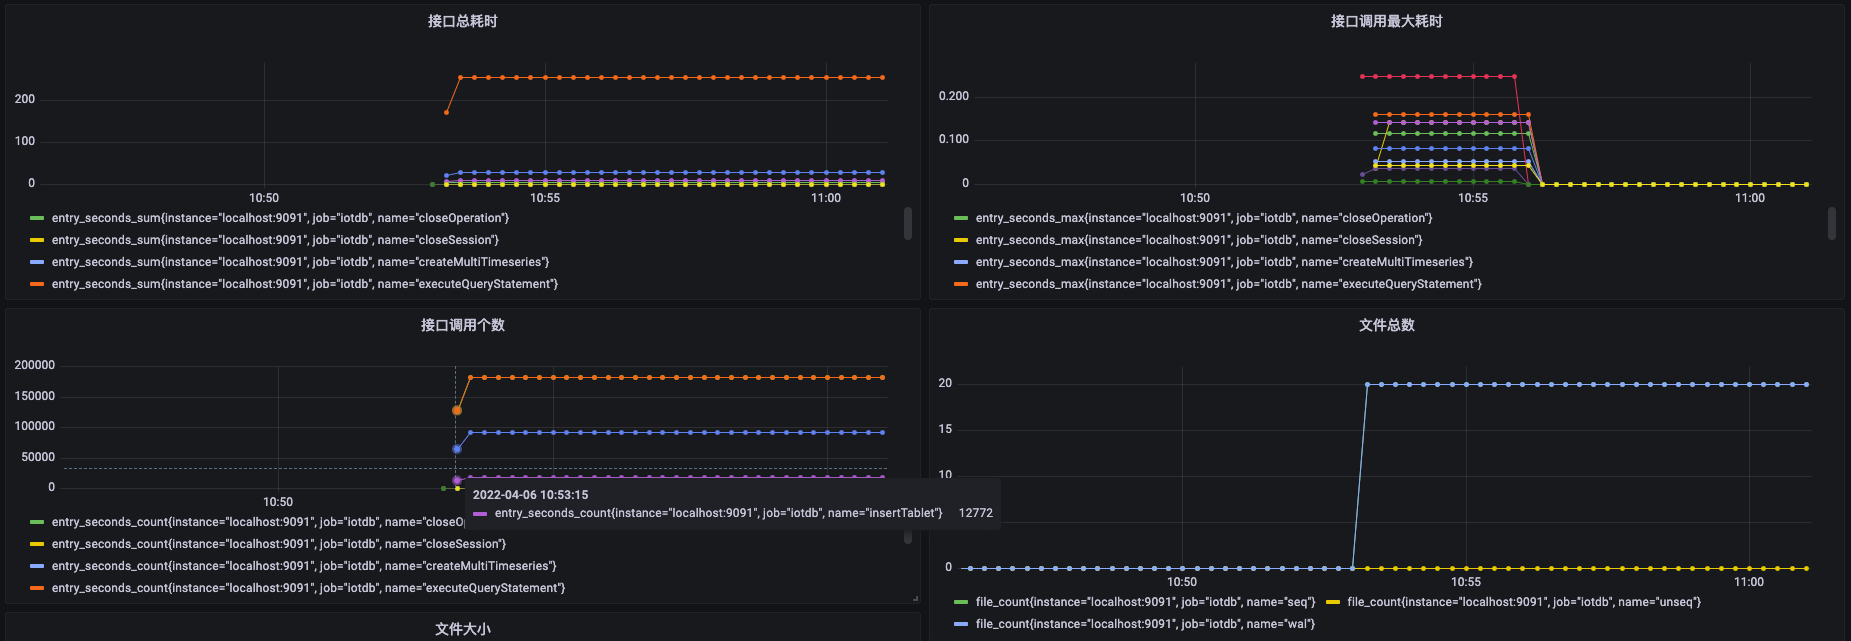
- 选择关注的监控指标可视化完成后,我们就得到了这样的面板:
后续我们还会继续分享Apache IoTDB监控模块,敬请期待!
参考
https://iotdb.apache.org/UserGuide/Master/Maintenance-Tools/Metric-Tool.html
一文带你使用Apache IoTDB系统监控模块
https://spricoder.github.io/2022/04/06/Apache%20IoTDB/metric/%E4%B8%80%E6%96%87%E5%B8%A6%E4%BD%A0%E4%BD%BF%E7%94%A8Apache%20IoTDB%E7%B3%BB%E7%BB%9F%E7%9B%91%E6%8E%A7/